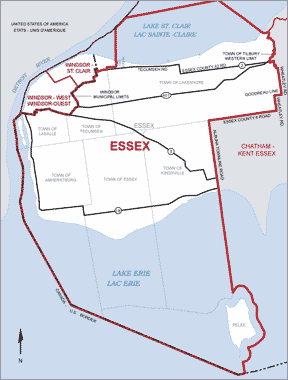
In this model, the three existing ridings of Essex, Windsor West, and Windsor-St. Clair are combined into one riding, which we will call Windsor-Essex.
The new riding would elect three members of parliament.
 |
In this model, the three existing ridings of Essex, Windsor West, and Windsor-St. Clair are combined into one riding, which we will call Windsor-Essex. The new riding would elect three members of parliament. |
|---|
| Windsor-Essex- Actual results Ontario provincial Election 2003 | |||||||
|---|---|---|---|---|---|---|---|
| Liberal | Progressive Conservative | NDP | Green | Family Coalition | Other | Total | |
| Essex | 20,559 | 11,234 | 12,614 | 998 | 0 | 0 | 45,405 |
| Windsor West | 22,024 | 4,190 | 7,389 | 1,241 | 0 | 388 | 35,232 |
| Windsor-St. Clair | 19,692 | 4,162 | 10,433 | 1,315 | 0 | 253 | 35,855 |
| Total votes received | 62,275 | 19,586 | 30,436 | 3,554 | 0 | 641 | 116,492 |
| Seats won | 3 | 0 | 0 | 0 | 0 | 0 | 3 |
| Seat % | 100% | 0% | 0% | 0% | 0% | 0% | 100% |
| Vote % | 53.46% | 16.81% | 26.13% | 3.05% | 0.00% | 0.55% | 100% |
| Index of Distortion | +46.54 | -16.81 | -26.13 | -3.05 | 0 | -0.55 | 46.54 |
In the 2003 Ontario provincial election, all three ridings elected Liberal MPPs.
Under the existing voting system, 53.46% of the voters got the representative they voted for.
The other 46.54% of the votes were wasted.
In our model, the seats would have been allocated as follows:
| Windsor-Essex - Simulated Proportional Distribution -Ontario provincial election 2003 | |||||||
|---|---|---|---|---|---|---|---|
| Liberal | Progressive Conservative | NDP | Green | Family Coalition | Other | Total | |
| Total votes received | 62,275 | 19,586 | 30,436 | 3,554 | 0 | 641 | 116,492 |
| Seats won | 2 | 0 | 1 | 0 | 0 | 0 | 3 |
| Seat % | 66.67% | 0% | 33.33% | 0% | 0% | 0% | 100% |
| Vote % | 53.46% | 16.81% | 26.13% | 3.05% | 0.00% | 0.55% | 100% |
| Index of Distortion | +13.21 | -16.81 | +7.20 | -3.05 | 0 | -0.55 | 20.41 |
Under this model, 79.59% of the voters would have helped to elect a local representative.
Another 19.86% of the voters would know that their vote had helped to elect provincial list members, so they would also have representation.
Only 0.55% of the votes cast would not have helped to elect an MPP, and therefore would have been wasted.
| Simulated compensatory list seats - Ontario provincial election 2003 | |||||
|---|---|---|---|---|---|
| Liberal | Progressive Conservative | NDP | Green | Family | Total |
| 6 | 8 | 2 | 4 | 1 | 21 |
| Windsor-Essex - Actual results Canadian federal election 2000 | |||||||
|---|---|---|---|---|---|---|---|
| Liberal | Canadian Alliance | Progressive Conservative | NDP | Green | Other | Total | |
| Essex | 20,524 | 16,019 | 3,175 | 6,431 | 0 | 152 | 46,301 |
| Windsor West | 20,729 | 8,777 | 2,116 | 6,080 | 0 | 533 | 38,235 |
| Windsor-St. Clair | 16,600 | 5,639 | 1,906 | 17,001 | 390 | 95 | 41,631 |
| Total votes received | 57,853 | 30,435 | 7,197 | 29,512 | 390 | 780 | 126,167 |
| Seats won | 2 | 0 | 0 | 1 | 0 | 0 | 3 |
| Seat% | 66.67% | 0% | 0% | 33.33% | 0% | 0% | 100% |
| Vote % | 45.85% | 24.12% | 5.70% | 23.39% | 0.31% | 0.62% | 100% |
| Index of Distortion | +20.82 | -24.12 | -5.70 | +9.94 | -0.31 | -0.62 | 30.76 |
In the 2000 Canadian federal election, the three ridings elected 2 Liberal MPs and a New Democrat.
Under the existing voting system, 46.17% of the voters got the representative they voted for.
The other 53.83% of the votes were wasted.
In our model, the seats would have been allocated as follows:
| Windsor-Essex - Simulated Proportional Distribution -Canadian federal election 2000 | |||||||
|---|---|---|---|---|---|---|---|
| Liberal | Canadian Alliance | Progressive Conservative | NDP | Green | Other | Total | |
| Total votes received | 57,853 | 30,435 | 7,197 | 29,512 | 390 | 780 | 126,167 |
| Seats won | 1 | 1 | 0 | 1 | 0 | 0 | 3 |
| Seat % | 33.33% | 33.33% | 0% | 33.33% | 0% | 0% | 100% |
| Vote % | 45.85% | 24.12% | 5.70% | 23.39% | 0.31% | 0.62% | 100% |
| Index of Distortion | -12.52 | +9.21 | -5.70 | +9.94 | -0.31 | -0.62 | 19.15 |
Under this model, 93.36% of the voters would have helped to elect a local representative.
Another 6.01% of the voters would know that their vote had helped to elect provincial list members, so they would also have representation.
Only 0.62% of the votes cast would not have helped to elect an MP, and therefore would have been wasted.
| Ontario - Simulated compensatory list seats - Canadian federal election 2000 | |||||
|---|---|---|---|---|---|
| Liberal | Canadian Alliance | Progressive Conservative | NDP | Green | Total |
| 0 | 9 | 6 | 5 | 1 | 21 |