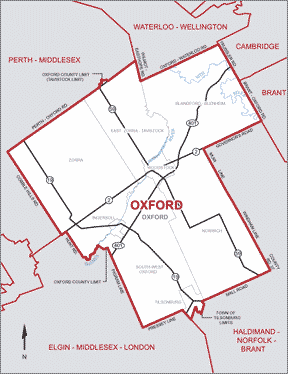
In this model, Oxford would remain a single-member riding.
 |
In this model, Oxford would remain a single-member riding. |
|---|
| Oxford - Actual results Ontario provincial election 2003 | |||||||
|---|---|---|---|---|---|---|---|
| Liberal | Progressive Conservative | NDP | Green | Family | Other | Total | |
| Votes received | 16,135 | 18,959 | 5,318 | 838 | 710 | 0 | 42,649 |
| Seats won | 0 | 1 | 0 | 0 | 0 | 0 | 1 |
| Seat % | 0% | 100% | 0% | 0% | 0% | 0% | 100% |
| Vote % | 37.83% | 44.45% | 12.47% | 1.96% | 1.62% | 1.67% | 100% |
| Distortion | -37.83 | +55.55 | -12.47 | -1.96 | -1.62 | -1.67 | 55.55 |
In the 2003 Ontario provincial election, the riding elected a Progressive Conservative MPP.
Under the existing voting system, 44.45% of the voters got the representative they voted for.
The other 55.55% of the votes were wasted.
In our model, we assume that the Progressive Conservative would still have won the riding.
Under this model, 44.45% of the voters in Oxford would still have gotten the local representative they voted for.
However, another 53.88% of the voters would know that their vote had helped to elect provincial list members, so they too would have representation.
Only 1.67% of the votes cast would not have helped to elect an MPP, and therefore would have been wasted.
| Simulated compensatory list seats - Ontario provincial election 2003 | |||||
|---|---|---|---|---|---|
| Liberal | Progressive Conservative | NDP | Green | Family | Total |
| 6 | 8 | 2 | 4 | 1 | 21 |
| Oxford - Actual results Canadian federal election 2000 | |||||||
|---|---|---|---|---|---|---|---|
| Liberal | Canadian Alliance | Progressive Conservative | NDP | Green | Other | Total | |
| Votes received | 15,181 | 11,455 | 13,050 | 2,254 | 0 | 763 | 42,703 |
| Seats won | 1 | 0 | 0 | 0 | 0 | 0 | 1 |
| Seat % | 100% | 0% | 0% | 0% | 0% | 0% | 100% |
| Vote % | 35.55% | 26.82% | 30.56% | 5.28% | 0.00% | 1.79% | 100% |
| Distortion | +64.45 | -26.82 | -30.56 | -5.28 | 0 | -1.79 | 64.45 |
In the 2000 Canadian federal election, the riding elected a Liberal MP.
Under the existing voting system, 35.55% of the voters got the representative they voted for.
The other 64.45% of the votes were wasted.
In our model, we assume that the Liberal would still have won the riding.
Under this model, 35.55% of the voters in Oxford would still have gotten the local representative they voted for.
However, another 62.66% of the voters would know that their vote had helped to elect provincial list members, so they too would have representation.
Only 1.79% of the votes cast would not have helped to elect an MP, and therefore would have been wasted.
| Simulated Ontario compensatory list seats - Canadian federal election 2000 | |||||
|---|---|---|---|---|---|
| Liberal | Canadian Alliance | Progressive Conservative | NDP | Green | Total |
| 0 | 9 | 6 | 5 | 1 | 21 |