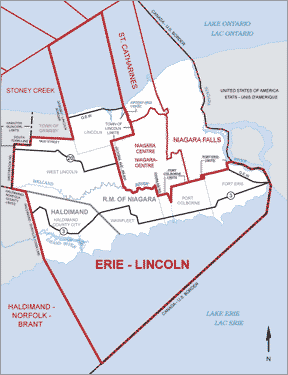
In this model, the four existing ridings of Erie-Lincoln, Niagara Centre, Niagara Falls and St. Catharines are combined into one riding, which we will call Niagara.
The new riding would elect four members of parliament.

In this model, the four existing ridings of Erie-Lincoln, Niagara Centre, Niagara Falls and St. Catharines are combined into one riding, which we will call Niagara. The new riding would elect four members of parliament. |
 |
|---|
| Niagara - Actual results Ontario provincial Election 2003 | |||||||
|---|---|---|---|---|---|---|---|
| Liberal | Progressive Conservative | NDP | Green | Family Coalition | Other | Total | |
| Erie-Lincoln | 16,290 | 20,348 | 3,950 | 713 | 666 | 0 | 41,967 |
| Niagara Centre | 12,526 | 10,336 | 23,289 | 768 | 0 | 0 | 46,919 |
| Niagara Falls | 18,904 | 15,353 | 4,962 | 1,124 | 0 | 0 | 40,343 |
| St. Catharines | 25,319 | 12,932 | 3,944 | 1,167 | 714 | 0 | 44,076 |
| Total votes received | 73,039 | 58,969 | 36,145 | 3,772 | 1,380 | 0 | 173,305 |
| Seats won | 2 | 1 | 1 | 0 | 0 | 0 | 4 |
| Seat % | 50% | 25% | 25% | 0% | 0% | 0% | 100% |
| Vote % | 42.14% | 34.03% | 20.86% | 2.18% | 0.80% | 0.00% | 100% |
| Index of Distortion | +7.86 | -9.03 | +4.14 | -2.18 | -0.80 | 0 | 12.00 |
In the 2003 Ontario provincial election, these three ridings elected 2 Liberals, 1 Progressive Conservative and 1 NDP MPP.
Under the existing voting system, 50.70% of the voters got the representative they voted for.
The other 49.30% of the votes were wasted.
In our model, the seats would have been allocated as follows:
| Niagara - Simulated Proportional Distribution -Ontario provincial election 2003 | |||||||
|---|---|---|---|---|---|---|---|
| Liberal | Progressive Conservative | NDP | Green | Family Coalition | Other | Total | |
| Total votes received | 73,039 | 58,969 | 36,145 | 3,772 | 1,380 | 512 | 173,305 |
| Seats won | 2 | 1 | 1 | 0 | 0 | 0 | 4 |
| Seat % | 50.00% | 25.00% | 25.00% | 0% | 0% | 0% | 100% |
| Vote % | 42.14% | 34.03% | 20.86% | 2.18% | 0.80% | 0% | 100% |
| Index of Distortion | +7.86 | -9.03 | +4.14 | -2.18 | -0.80 | 0 | 12.00 |
Under this model, 97.02% of the voters would have helped to elect a local representative.
The other 2.98% of the voters would know that their vote had helped to elect provincial list members, so they would also have representation.
All of the votes cast would have helped to elect an MPP, and therefore none would have been wasted.
| Simulated compensatory list seats - Ontario provincial election 2003 | |||||
|---|---|---|---|---|---|
| Liberal | Progressive Conservative | NDP | Green | Family | Total |
| 6 | 8 | 2 | 4 | 1 | 21 |
| Niagara - Actual results Canadian federal election 2000 | |||||||
|---|---|---|---|---|---|---|---|
| Liberal | Canadian Alliance | Progressive Conservative | NDP | Green | Other | Total | |
| Erie-Lincoln | 17,054 | 14,992 | 5,174 | 2,4,23 | 0 | 756 | 40,399 |
| Niagara Centre | 21,641 | 13,313 | 4,893 | 7,029 | 0 | 439 | 47,315 |
| Niagara Falls | 17,907 | 11,999 | 6,077 | 2,356 | 501 | 155 | 38,995 |
| St. Catharines | 20,992 | 15,871 | 6,522 | 2,878 | 0 | 462 | 46,725 |
| Total votes received | 77,594 | 56,175 | 22,666 | 14,686 | 501 | 1,812 | 173,434 |
| Seats won | 4 | 0 | 0 | 0 | 0 | 0 | 4 |
| Seat% | 100% | 0% | 0% | 0% | 0% | 0% | 100% |
| Vote % | 44.74% | 32.39% | 13.07% | 8.47% | 0.29% | 1.04% | 100% |
| Index of Distortion | +55.26 | -32.39 | -13.07 | -8.47 | -0.29 | -1.04 | 55.26 |
In the 2000 Canadian federal election, all four ridings elected Liberal MPs.
Under the existing voting system, 44.74% of the voters got the representative they voted for.
The other 55.26% of the votes were wasted.
In our model, the seats would have been allocated as follows:
| Niagara - Simulated Proportional Distribution -Canadian federal election 2000 | |||||||
|---|---|---|---|---|---|---|---|
| Liberal | Canadian Alliance | Progressive Conservative | NDP | Green | Other | Total | |
| Total votes received | 77,594 | 56,175 | 22,666 | 14,686 | 501 | 1,812 | 173,434 |
| Seats won | 2 | 1 | 1 | 0 | 0 | 0 | 4 |
| Seat% | 50% | 25% | 25% | 0% | 0% | 0% | 100% |
| Vote % | 44.74% | 32.39% | 13.07% | 8.47% | 0.29% | 1.04% | 100% |
| Index of Distortion | +5.26 | -7.39 | +11.93 | -8.47 | -0.29 | -1.04 | 17.19 |
Under this model, 90.20% of the voters would have helped to elect a local representative.
Another 8.76% of the voters would know that their vote had helped to elect provincial list members, so they would also have representation.
Only 1.04% of the votes cast would not have helped to elect an MP, and therefore would be wasted.
| Ontario - Simulated compensatory list seats - Canadian federal election 2000 | |||||
|---|---|---|---|---|---|
| Liberal | Canadian Alliance | Progressive Conservative | NDP | Green | Total |
| 0 | 9 | 6 | 5 | 1 | 21 |