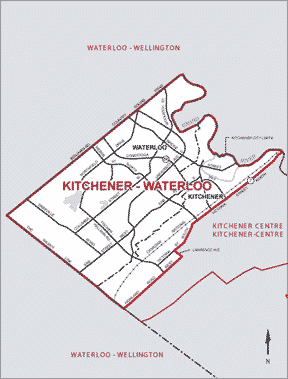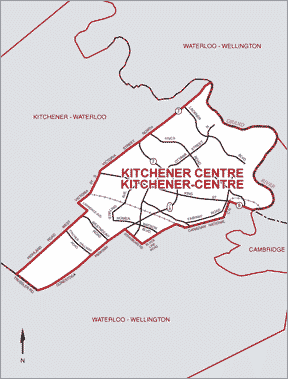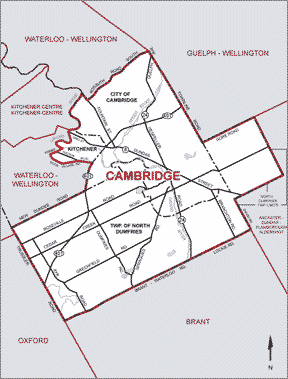


In this model, the three existing ridings of Cambridge, Kitchener Centre and Kitchener-Waterloo are combined into one riding, which we will call Kitchener-Waterloo-Cambridge.
The new riding would elect three members of parliament.
 |
 |
 |
In this model, the three existing ridings of Cambridge, Kitchener Centre and Kitchener-Waterloo are combined into one riding, which we will call Kitchener-Waterloo-Cambridge. The new riding would elect three members of parliament. |
||
|---|---|---|
| Kitchener-Waterloo-Cambridge - Actual results Ontario provincial Election 2003 | |||||||
|---|---|---|---|---|---|---|---|
| Liberal | Progressive Conservative | NDP | Green | Family Coalition | Other | Total | |
| Cambridge | 16,559 | 19,996 | 8,513 | 983 | 1,001 | 0 | 47,052 |
| Kitchener Centre | 18,280 | 16,120 | 6,781 | 1,728 | 0 | 0 | 42,909 |
| Kitchener-Waterloo | 22,456 | 23,957 | 6,084 | 1,774 | 949 | 395 | 55,615 |
| Total votes received | 57,295 | 60,073 | 21,378 | 4,485 | 1,950 | 395 | 145,576 |
| Seats won | 1 | 2 | 0 | 0 | 0 | 0 | 3 |
| Seat % | 33.33% | 66.67% | 0% | 0% | 0% | 0% | 100% |
| Vote % | 39.36% | 41.27% | 14.69% | 3.08% | 1.34% | 0.27% | 100% |
| Index of Distortion | -6.03 | +25.40 | -14.69 | -3.08 | -1.34 | -0.27 | 25.40 |
In the 2003 Ontario provincial election, the three ridings elected 2 Progressive Conservative MPPs and a Liberal.
Under the existing voting system, 42.75% of the voters got the representative they voted for.
The other 57.25% of the votes were wasted.
In our model, the seats would have been allocated as follows:
| Kitchener-Waterloo-Cambridge - Simulated Proportional Distribution -Ontario provincial election 2003 | |||||||
|---|---|---|---|---|---|---|---|
| Liberal | Progressive Conservative | NDP | Green | Family Coalition | Other | Total | |
| Total votes received | 57,295 | 60,073 | 21,378 | 4,485 | 1,950 | 395 | 145,576 |
| Seats won | 1 | 1 | 1 | 0 | 0 | 0 | 3 |
| Seat % | 33.33% | 33.33% | 33.33% | 0% | 0% | 0% | 100% |
| Vote % | 39.36% | 41.27% | 14.69% | 3.08% | 1.34% | 0.27% | 100% |
| Index of Distortion | -6.03 | -7.94 | +18.64 | -3.08 | -1.34 | -0.27 | 18.64 |
Under this model, 95.32% of the voters would have helped to elect a local representative.
Another 4.42% of the voters would know that their vote had helped to elect provincial list members, so they would also have representation.
Only 0.27% of the votes cast would not have helped to elect an MPP, and therefore would have been wasted.
| Simulated compensatory list seats - Ontario provincial election 2003 | |||||
|---|---|---|---|---|---|
| Liberal | Progressive Conservative | NDP | Green | Family | Total |
| 6 | 8 | 2 | 4 | 1 | 21 |
| Kitchener-Waterloo-Cambridge - Actual results Canadian federal election 2000 | |||||||
|---|---|---|---|---|---|---|---|
| Liberal | Canadian Alliance | Progressive Conservative | NDP | Green | Other | Total | |
| Cambridge | 22,148 | 14,915 | 5,988 | 4,111 | 0 | 370 | 47,532 |
| Kitchener Centre | 23,511 | 11,603 | 6,162 | 3,058 | 0 | 158 | 44,492 |
| Kitchener-Waterloo | 27,132 | 12,402 | 8,621 | 4,394 | 809 | 542 | 53,900 |
| Total votes received | 72,791 | 38,920 | 20,771 | 11,563 | 809 | 1,070 | 145,924 |
| Seats won | 3 | 0 | 0 | 0 | 0 | 0 | 3 |
| Seat% | 100.00% | 0% | 0% | 0% | 0% | 0% | 100% |
| Vote % | 49.88% | 26.67% | 14.23% | 7.92% | 0.55% | 0.73% | 100% |
| Index of Distortion | +50.12 | -26.67 | -14.23 | -7.92 | -0.55 | -0.73 | 50.12 |
In the 2000 Canadian federal election, the three ridings elected 3 Liberal MPs.
Under the existing voting system, 49.88% of the voters got the representative they voted for.
The other 50.12% of the votes were wasted.
In our model, the seats would have been allocated as follows:
| Kitchener-Waterloo-Cambridge - Simulated Proportional Distribution -Canadian federal election 2000 | |||||||
|---|---|---|---|---|---|---|---|
| Liberal | Canadian Alliance | Progressive Conservative | NDP | Green | Other | Total | |
| Total votes received | 72,791 | 38,920 | 20,771 | 11,563 | 809 | 1,070 | 145,924 |
| Seats won | 2 | 1 | 0 | 0 | 0 | 0 | 3 |
| Seat % | 66.67% | 33.33% | 0% | 0% | 0% | 0% | 100% |
| Vote % | 49.88% | 26.67% | 14.23% | 7.92% | 0.55% | 0.73% | 100% |
| Index of Distortion | +16.79 | +6.66 | -14.23 | -7.92 | -0.55 | -0.73 | 23.45 |
Under this model, 76.55% of the voters would have helped to elect a local representative.
Another 22.70% of the voters would know that their vote had helped to elect provincial list members, so they would also have representation.
Only 0.73% of the votes cast would not have helped to elect an MP, and therefore would have been wasted.
| Ontario - Simulated compensatory list seats - Canadian federal election 2000 | |||||
|---|---|---|---|---|---|
| Liberal | Canadian Alliance | Progressive Conservative | NDP | Green | Total |
| 0 | 9 | 6 | 5 | 1 | 21 |