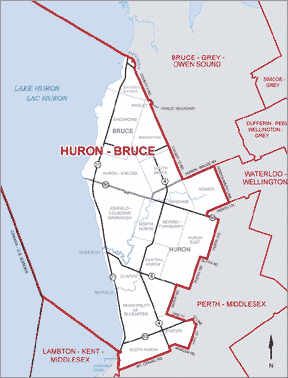
In this model, Huron-Bruce would remain a single-member riding.
In this model, Huron-Bruce would remain a single-member riding. |
|
|---|
| Huron-Bruce - Actual results Ontario provincial election 2003 | |||||||
|---|---|---|---|---|---|---|---|
| Liberal | Progressive Conservative | NDP | Green | Family | Other | Total | |
| Votes received | 19,879 | 16,594 | 4,973 | 934 | 902 | 127 | 43,409 |
| Seats won | 1 | 0 | 0 | 0 | 0 | 0 | 1 |
| Seat % | 100% | 0% | 0% | 0% | 0% | 0% | 100% |
| Vote % | 45.79% | 38.23% | 11.46% | 2.15% | 2.08% | 0.29% | 100% |
| Distortion | +54.21 | -38.23 | -11.46 | -2.15 | -2.08 | -0.29 | 54.21 |
In the 2003 Ontario provincial election, the riding elected a Liberal MPP.
Under the existing voting system, 45.79% of the voters got the representative they voted for.
The other 54.21% of the votes were wasted.
In our model, we assume that the Liberal would still have won the riding.
Under this model, 45.79% of the voters in Huron-Bruce would still have gotten the local representative they voted for.
However, another 53.92% of the voters would know that their vote had helped to elect provincial list members, so they too would have representation.
Only 0.29% of the votes cast would not have helped to elect an MPP, and therefore would have been wasted.
| Simulated compensatory list seats - Ontario provincial election 2003 | |||||
|---|---|---|---|---|---|
| Liberal | Progressive Conservative | NDP | Green | Family | Total |
| 6 | 8 | 2 | 4 | 1 | 21 |
| Huron-Bruce - Actual results Canadian federal election 2000 | |||||||
|---|---|---|---|---|---|---|---|
| Liberal | Canadian Alliance | Progressive Conservative | NDP | Green | Other | Total | |
| Votes received | 21,547 | 10,343 | 8,138 | 2,669 | 0 | 474 | 43,171 |
| Seats won | 1 | 0 | 0 | 0 | 0 | 0 | 1 |
| Seat % | 100% | 0% | 0% | 0% | 0% | 0% | 100% |
| Vote % | 49.91% | 23.96% | 18.85% | 6.18% | 0.00% | 1.10% | 100% |
| Distortion | +50.09 | -23.96 | -18.85 | -6.18 | 0 | -1.10 | 50.09 |
In the 2000 Canadian federal election, the riding elected a Liberal MP.
Under the existing voting system, 49.91% of the voters got the representative they voted for.
The other 50.09% of the votes were wasted.
In our model, we assume that the Liberal would still have won the riding.
Under this model, 49.91% of the voters in Huron-Bruce would still have gotten the local representative they voted for.
However, another 48.99% of the voters would know that their vote had helped to elect provincial list members, so they too would have representation.
Only 1.10% of the votes cast would not have helped to elect an MP, and therefore would have been wasted.
| Simulated Ontario compensatory list seats - Canadian federal election 2000 | |||||
|---|---|---|---|---|---|
| Liberal | Canadian Alliance | Progressive Conservative | NDP | Green | Total |
| 0 | 9 | 6 | 5 | 1 | 21 |