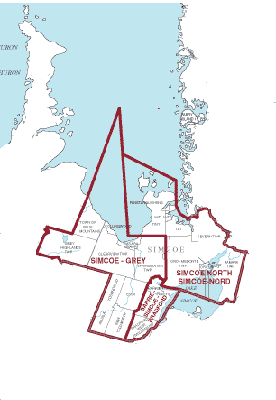
In this model, the three existing ridings of Barrie-Simcoe-Bradford, Simcoe North, and Simcoe-Grey are combined into one riding, which we will call Barrie-Simcoe.
The new riding would elect three members of parliament.

In this model, the three existing ridings of Barrie-Simcoe-Bradford, Simcoe North, and Simcoe-Grey are combined into one riding, which we will call Barrie-Simcoe. The new riding would elect three members of parliament. |
 |
|---|
| Barrie-Simcoe - Actual results Ontario provincial Election 2003 | |||||||
|---|---|---|---|---|---|---|---|
| Liberal | Progressive Conservative | NDP | Green | Family Coalition | Other | Total | |
| Barrie-Simcoe-Bradford | 21,998 | 31,529 | 5,641 | 1,278 | 441 | 0 | 60,887 |
| Simcoe North | 19,713 | 23,393 | 5,515 | 1,540 | 453 | 101 | 50,715 |
| Simcoe-Grey | 17,505 | 26,114 | 5,032 | 875 | 801 | 411 | 50,738 |
| Total votes received | 59,216 | 81,036 | 16,188 | 3,693 | 1,695 | 512 | 162,340 |
| Seats won | 0 | 3 | 0 | 0 | 0 | 0 | 3 |
| Seat % | 0% | 100% | 0% | 0% | 0% | 0% | 100% |
| Vote % | 36.48% | 49.92% | 9.97% | 2.27% | 1.04% | 0.32% | 100% |
| Index of Distortion | -36.48 | +50.08 | -9.97 | -2.27 | -1.04 | -0.32 | 50.08 |
In the 2003 Ontario provincial election, all three ridings elected Progressive Conservative MPPs.
Under the existing voting system, 49.92% of the voters got the representative they voted for.
The other 50.08% of the votes were wasted.
In our model, the seats would have been allocated as follows:
| Barrie-Simcoe - Simulated Proportional Distribution -Ontario provincial election 2003 | |||||||
|---|---|---|---|---|---|---|---|
| Liberal | Progressive Conservative | NDP | Green | Family Coalition | Other | Total | |
| Total votes received | 59,216 | 81,036 | 16,188 | 3,693 | 1,695 | 512 | 162,340 |
| Seats won | 1 | 2 | 0 | 0 | 0 | 0 | 3 |
| Seat % | 33.33% | 66.67% | 0% | 0% | 0% | 0% | 100% |
| Vote % | 36.48% | 49.92% | 9.97% | 2.27% | 1.04% | 0.32% | 100% |
| Index of Distortion | -3.15 | +16.75 | -9.97 | -2.27 | -1.04 | -0.32 | 16.75 |
Under this model, 86.40% of the voters would have helped to elect a local representative.
Another 13.28% of the voters would know that their vote had helped to elect provincial list members, so they would also have representation.
Only 0.32% of the votes cast would not have helped to elect an MPP, and therefore would be wasted.
| Simulated compensatory list seats - Ontario provincial election 2003 | |||||
|---|---|---|---|---|---|
| Liberal | Progressive Conservative | NDP | Green | Family | Total |
| 6 | 8 | 2 | 4 | 1 | 21 |
| Barrie-Simcoe - Actual results Canadian federal election 2000 | |||||||
|---|---|---|---|---|---|---|---|
| Liberal | Canadian Alliance | Progressive Conservative | NDP | Green | Other | Total | |
| Barrie-Simcoe-Bradford | 26,309 | 17,600 | 7,588 | 2,385 | 0 | 621 | 54,503 |
| Simcoe North | 24,510 | 14,283 | 6,914 | 2,272 | 0 | 305 | 48,284 |
| Simcoe-Grey | 22,224 | 16,113 | 8,655 | 1,646 | 0 | 997 | 49,635 |
| Total votes received | 73,043 | 47,996 | 23,157 | 6,303 | 0 | 1,923 | 152,422 |
| Seats won | 3 | 0 | 0 | 0 | 0 | 0 | 3 |
| Seat% | 100% | 0% | 0% | 0% | 0% | 0% | 100% |
| Vote % | 47.92% | 31.49% | 15.19% | 4.14% | 0.00% | 1.26% | 100% |
| Index of Distortion | +52.08 | -31.49 | -15.19 | -4.14 | 0 | -1.26 | 52.08 |
In the 2000 Canadian federal election, all three ridings elected Liberal MPs.
Under the existing voting system, 47.92% of the voters got the representative they voted for.
The other 52.08% of the votes were wasted.
In our model, the seats would have been allocated as follows:
| Barrie-Simcoe - Simulated Proportional Distribution -Canadian federal election 2000 | |||||||
|---|---|---|---|---|---|---|---|
| Liberal | Canadian Alliance | Progressive Conservative | NDP | Green | Other | Total | |
| Total votes received | 73,043 | 47,996 | 23,157 | 6,303 | 0 | 1,923 | 152,422 |
| Seats won | 2 | 1 | 0 | 0 | 0 | 0 | 3 |
| Seat % | 66.67% | 33.33% | 0% | 0% | 0% | 0% | 100% |
| Vote % | 47.92% | 31.49% | 15.19% | 4.14% | 0.00% | 1.26% | 100% |
| Index of Distortion | +18.75 | +1.84 | -15.19 | -4.14 | 0 | -1.26 | 20.59 |
Under this model, 79.41% of the voters would have helped to elect a local representative.
Another 19.33% of the voters would know that their vote had helped to elect provincial list members, so they would also have representation.
Only 1.26% of the votes cast would not have helped to elect an MP, and therefore would be wasted.
| Ontario - Simulated compensatory list seats - Canadian federal election 2000 | |||||
|---|---|---|---|---|---|
| Liberal | Canadian Alliance | Progressive Conservative | NDP | Green | Total |
| 0 | 9 | 6 | 5 | 1 | 21 |